Picture a shipyard at dawn in 2026.
Steel hulls under construction. Thousands of workers. Dozens of ships on the orderbook. Contracts inked for vessels that will sail well into the 2050s.
None of those welders are debating “Is cruising a fad?” They are building physical bets on a future that most boardrooms still talk about in vague terms: “demand,” “growth,” “pent‑up desire.”
That disconnect is the opportunity.
Global ocean‑going cruise passenger volume reached 37.2 million in 2025, a record high. Industry reports show strong repeat intent, a robust orderbook, and expectations of continued growth in capacity through the early 2030s. Yet most of the conversation still lives on the shifting sands of trend lines, sentiment, and recycled consensus.
A First Principles question cuts through the fog:
What if the future size of the cruise industry is not a mystery, but a math problem hiding in plain sight?
If that is true, then the right response is not to guess louder. It is to strip the category down to the variables that actually determine how big it can become, and then ask what happens when those variables compound over 15–25 years.
That is where an adapted version of the Drake equation becomes surprisingly powerful.
Why we guess wrong about the future
The cruise industry is no stranger to bad forecasts.
- At various points, commentators have confidently predicted that cruising was a niche that would never go mainstream.
- At other moments, they have assumed growth would be linear forever, as if ports, regulation, and demographics did not exist.
Reality has been more complicated and more interesting. The industry has grown dramatically, but with shocks, pauses, and structural constraints. It has absorbed pandemics, geopolitical tensions, and fuel price volatility—and then resumed climbing.
Why do so many smart people get the long term wrong?
Because most forecasts are narrative-first and structure-second. They start from a story: “People love cruising,” or “Gen Z hates cruising,” or “ESG will kill cruising,” and then work backwards into numbers that fit the plot.
First Principles thinking reverses that. It asks:
- What is actually true, stripped of assumption, convention, and comparison?
- What are the non‑negotiable constraints and drivers?
- What variables really govern size and longevity?
When you look at cruising through that lens, you discover something important:
Category growth is not magic. It is math, plus leadership.
And that is where an adapted Drake equation comes in.
A cruise version of Drake
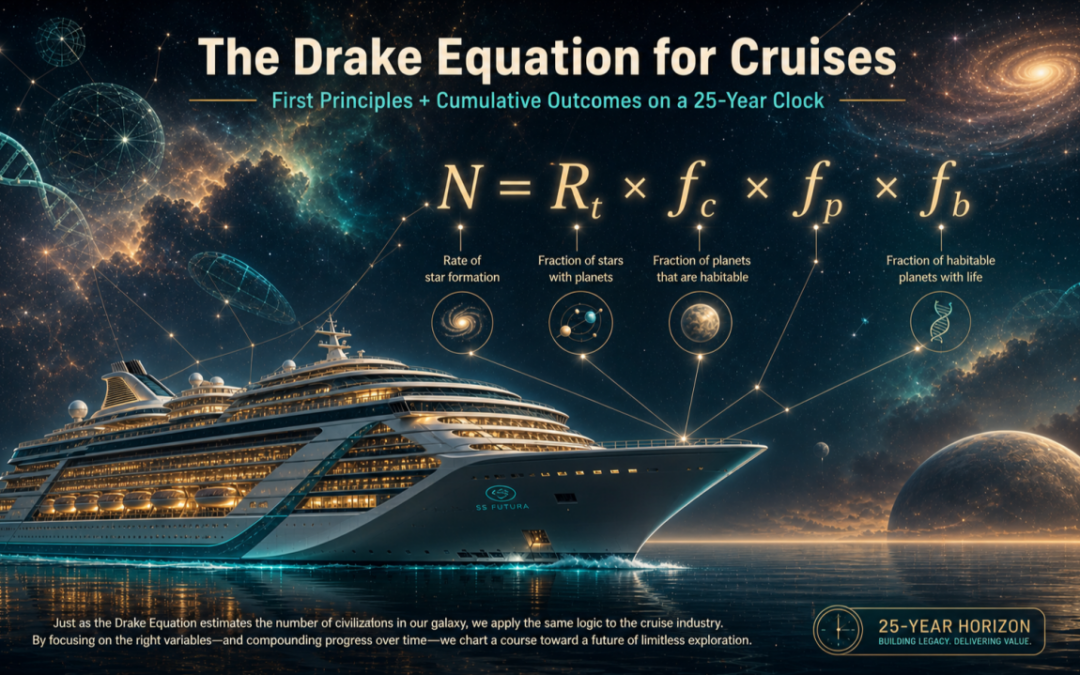
In astrobiology, the Drake equation does not claim to predict the exact number of intelligent civilizations in the galaxy. Instead, it multiplies a base rate (how often stars form) by a series of fractions (how many have planets, how many of those are habitable, how many develop life, intelligence, and technology, and how long they last).
Its value is not the answer. Its value is the discipline.
You can do the same thing for cruising.
A simple cruise‑Drake looks like this:
Ncruise=Rt×fc×fp×fbN_{\text{cruise}} = R_t \times f_c \times f_p \times f_bNcruise=Rt×fc×fp×fb
Where:
- RtR_tRt is the future pool of effective leisure trips relevant to cruising (not every road trip, but trips that could realistically be cruise‑adjacent).
- fcf_cfc is the fraction of those trips that are structurally cruise‑eligible (time, geography, health, access).
- fpf_pfp is the fraction of eligible trips taken by travelers predisposed to cruise (psychographics, attitudes, culture).
- fbf_bfb is the fraction of that predisposed demand the industry actually captures (capacity, pricing, distribution, fit).
From First Principles, these are the irreducible levers.
The category gets larger only if one or more of them rises. It can rise because the total leisure market expands. It can rise because more trips become structurally cruiseable. It can rise because more travelers want the product. Or it can rise because the industry becomes better at converting latent desire into booked cabins.
This is where the dilution ends and the transformation begins.
Once the variables are visible, strategy stops being theatrical. Leaders can stop confusing motion with progress and start asking: which variable are we moving, by how much, and for how long?
That is the territory of cumulative outcomes.
Why 2040 and 2050 matter more than 2030
Most industry outlooks stop at 2028 or 2030.
That is understandable—investors and reporters like short horizons. But it misses the true power of the cruise business model: ships live on a 25‑year clock.
Orderbook data and industry analysis suggest that capacity should grow by roughly 30% by 2033, from about 34 million to around 44 million passengers of annual capacity. Dozens of ships and tens of billions of dollars are already committed into the next decade.
New ships are not tactical decisions. They are generational commitments. A vessel delivered in 2027 will still be shaping supply, pricing, emissions profiles, and itinerary options in 2050.
In other words:
- The fleet being welded together today is a direct bet on the 2040s and 2050s.
- The question is not whether those ships will exist. The question is whether demand will meet them—or be reshaped by them.
That is why a 15‑year horizon (2040) and a 25‑year horizon (2050) are more revealing than any near‑term forecast. They are the timescales on which the cumulative effect of small annual shifts either compounds into a transformed category or dissolves into missed opportunity.
The cumulative outcomes view: 2025 → 2040 → 2050
Start with what we know.
- 2025: 37.2 million ocean‑going cruise passengers globally.
- The leisure travel market itself is projected to continue growing through 2035 and beyond.
- The orderbook implies more capacity through the 2030s than the industry has ever deployed before.
Now ask a simple question:
If the key variables Rt,fc,fp,fbR_t, f_c, f_p, f_bRt,fc,fp,fb improve modestly, consistently, and for long enough, where could the category end up?
Here is a disciplined, scenario‑based answer:
Year Base scenario Optimistic scenario 2025 actual 37.2M 2040 60M-80M 2050 70M-100M
These outcomes are more modest than they look.
- 37.2M → 60M by 2040 is about 3.2% annual growth over 15 years.
- 37.2M → 70M by 2050 is about 2.6% annual growth over 25 years.
- 37.2M → 100M by 2050 is about 4.0% annual growth over 25 years.
The difference between the base and optimistic lines is not a leap of faith. It is the compounded effect of small changes in four variables, sustained over decades.
This is Cumulative Outcomes in action. The future does not need to be disrupted by one giant breakthrough. It can be reshaped by the quiet, compounding movement of parameters that most leaders barely name.
What the 2040 and 2050 base case actually requires
Let’s make this painfully concrete.
A 2050 base case of roughly 70 million passengers can be reached with surprisingly moderate shifts from 2025.
One plausible path:
- RtR_tRt (effective leisure trips) grows from ~1.2 billion to ~1.6 billion, driven by global leisure expansion and rising trip frequency.
- fcf_cfc (structural eligibility) rises from 10% to 12%, as more trips become cruise‑compatible thanks to new homeports, better access, and more flexible itineraries.
- fpf_pfp (predisposition) rises from 35% to 39%, as younger and more affluent travelers see cruise as a natural choice rather than a niche.
- fbf_bfb (capture) rises from 90% to 95%, as the industry improves pricing, deployment, and distribution to convert predisposed demand.
No single number there is outrageous.
The 2040 base case of 60 million passengers is even more modest:
- RtR_tRt from 1.2B to about 1.5B.
- fcf_cfc from 10% to 11%.
- fpf_pfp from 35% to 38%.
- fbf_bfb from 90% to 93%.
That is it.
If those shifts happen and persist, the category could move from 37.2M to 60M by 2040 and to 70M by 2050—even accounting for shocks, retirements, and regulatory friction.
Think about what that really means:
- The industry does not need cruising to become universal.
- It needs a slightly larger global leisure pool, a slightly larger share of structurally eligible trips, a slightly larger share of predisposed travelers, and a slightly better ability to capture them.
Small numbers. Big implications. That is cumulative effect.
What the 2050 optimistic case requires
Now stretch the question:
What would it take to make 100 million cruise passengers a normal year by 2050?
The answer is not “hope” or “viral TikToks.” The answer is a more ambitious—but still grounded—set of parameter shifts.
One plausible optimistic path:
- RtR_tRt rises from ~1.2 billion to ~1.8 billion effective leisure trips, as the global leisure market grows and more of it becomes relevant to cruising.
- fcf_cfc rises from 10% to 13%, as more trips become structurally cruiseable in emerging markets and new itineraries.
- fpf_pfp rises from 35% to 42%, as cruising becomes culturally normal among multiple generations of affluent travelers, especially where expedition, yacht‑style, and experience‑rich products lead.
- fbf_bfb rises from 90% to 97%, as the industry approaches the practical ceiling of converting predisposed demand.
Again, none of those numbers are insane on their own.
What makes them demanding is that they must move together and stay moved over decades.
The 2040 optimistic case of 80 million passengers is the bridge. It suggests that the decisive years are the 2030s, when:
- The current orderbook is fully in the water.
- Demographic transitions accelerate.
- Climate and regulatory regimes tighten.
- And the industry either widens its aperture of demand—or locks itself into old definitions of what “cruise” is allowed to be.
In the optimistic 2050, the industry is not just bigger. It is different. It has:
- More origin markets feeding the system.
- More itineraries and ship types that fit diverse lives.
- More travelers for whom cruise is the default, not the exception.
- And a commercial engine that is extremely good at matching inventory to intent.
That is not magic. That is disciplined compounding.
Deepening each parameter: the real levers
To use this framework, you cannot leave the variables as abstractions. You have to ask, what moves them in practice?
1. Raising RtR_tRt: ride the right rivers
RtR_tRt is your total pool of effective leisure trips.
You do not control global GDP. You do control where you focus. Raising RtR_tRt for cruising means:
- Prioritizing origin markets where trip frequency and spend will rise fastest: Asia, India, the global upper middle class.
- Shaping products and distribution in those markets so that incremental leisure trips are cruise‑adjacent by design.
- Thinking in trip systems, not single bookings: how does cruise become a recurring part of a household’s leisure architecture?
If you are not present where RtR_tRt is growing, you are arguing with the river instead of riding it.
2. Raising fcf_cfc: make more trips cruiseable
fcf_cfc is the fraction of trips that can practically be cruises.
You move it by:
- Adding and upgrading homeports, especially in markets with growing outbound travel but underdeveloped cruise infrastructure.
- Designing shorter, flexible itineraries that fit modern constraints: hybrid work, school calendars, multigenerational schedules.
- Investing in accessibility, health protocols, and ship design so more people are physically and emotionally able to cruise.
- Adapting to environmental and port regulations early, not reactively, so itineraries remain viable instead of being forced into retreat.
If you want more cruise passengers, you must ensure more of the world’s trips can even be candidates.
3. Raising fpf_pfp: change what “cruise” means
fpf_pfp is the fraction of eligible trips taken by people who are predisposed to cruise.
This is where brand, product, and culture live.
You move it by:
- Moving beyond the “floating hotel” narrative into curated mobile habitat: part resort, part exploration platform, part social operating system.
- Leaning into products that fit how younger, affluent, and inheritance‑enabled travelers see themselves: expedition, yacht, wellness, purpose‑driven itineraries, learning and mastery.
- Telling better stories. Not more deck plans, but more identity: “Who do I get to be on this ship?”
- Using data (including your Bristol‑like assets) to understand psychographic predisposition and design for it, not against it.
Predisposition is not a constant. It is a design variable. Treat it like one.
4. Raising fbf_bfb: capture almost all of what you’ve earned
fbf_bfb is the fraction of predisposed demand the industry actually captures.
It is where operational excellence meets commercial courage.
You improve it by:
- Deploying capacity where predisposed demand actually exists, not where legacy patterns of deployment feel comfortable.
- Using AI‑driven yield management and experimentation to find the right price–value balance without eroding the brand.
- Reducing friction: make discovering, understanding, and booking the right cruise as easy as booking air and hotel.
- Strengthening advisor ecosystems and equipping them with tools that turn “interest” into “itinerary” at scale.
If you have travelers who want to cruise and could cruise but do not cruise, you have a capture problem, not a demand problem.
First Principles + Cumulative Outcomes: the leadership test
At this point, the adapted Drake equation stops being a clever metaphor and becomes a leadership mirror.
First Principles asks:
- What is actually true about your Rt,fc,fp,fbR_t, f_c, f_p, f_bRt,fc,fp,fb?
- Which assumptions are inherited from the past, not earned from the present?
- Which variables are you ignoring because they are harder to move?
Cumulative Outcomes adds the harder question:
- What small, repeatable actions are you willing to take every year, for 25 years, to move each variable in your favor?
- And what is the compounding cost of not doing so?
In your own life, you already know the answer. Each day you do not intentionally advance your goals is not only an opportunity to progress that is lost forever; it is a damaging dilution to the power of cumulative effect toward outcomes. The same is true at industry scale.
Advantage stops being incremental when clarity of truth meets consistency of action.
Ships are already being built for 2050. The steel is real. The question is whether the thinking that fills them will be equally long‑lived, or whether strategy will continue to operate on 25‑week cycles of noise.
So the next time someone asks, “How big can cruising get?” you might respond with a different question:
What are we willing to do, year after year, to move the four variables that make the answer inevitable?
Because the cruise industry may not need one giant breakthrough to become dramatically larger by 2050.
It may only need several small truths, acted on relentlessly, for long enough.
Onward!
David Giersdorf is the Founder of Global Voyages Group, a strategic advisory firm serving the cruise industry. A forty-year cruise industry veteran, he is the author of Hard Ships and the creator of the Strategic Alchemy platform. “I’ve invested over 100,000 hours—ten times Malcolm Gladwell’s 10,000-hour rule—building, leading, acquiring, and selling businesses across the global cruise and travel industry and the marketing and data sectors. My career spans operational leadership, strategic transformation, M&A, and turning around underperforming assets into market leaders. I’ve led teams from dozens to thousands, managed P&Ls, driven billions in revenue, and navigated organizations through growth, crisis, and fundamental reinvention. I now advise executives and organizations on strategy, leadership, resilience, and transformation through complexity, helping leaders move from survival to systematic excellence.”